
Result Files (Excel, etc.)
To access a complete download of the results of your analysis, click on the Download button in the Output file column on the Results tab of the corresponding Analysis page.
This will generate a ZIP file containing the complete set of results from your analysis in structured XLSX files, as well as some basic visualizations of the results as images and HTML files. These may be useful if you wish to do some manual post-processing of your results, for instance generating custom visualizations or quantifying the business case for the optimized supply system. The ZIP file is named after the ID of your project. Inside you will find 3 folders and one excel file:
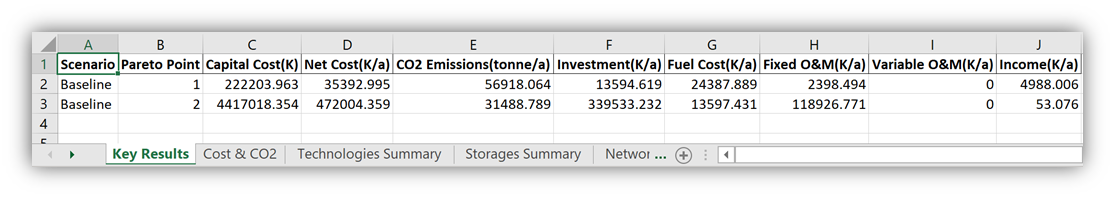
1. Excel file (Summary)
This excel file is named after the scenario you executed. It is a summary of the excel files in the “Results Tables” folder and contains the results for all the pareto points.
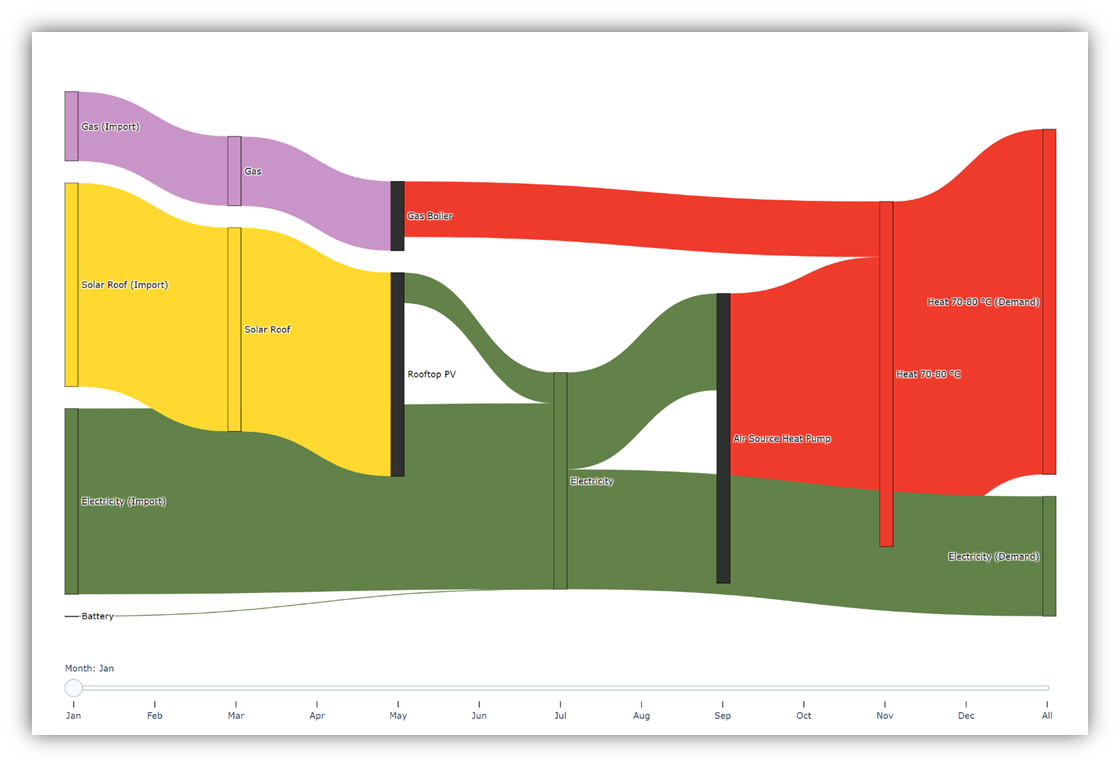
2. Folder "Energy Diagrams"
It contains the resulting Sankey energy diagrams of the optimal system for each solution and each month. There are Sankey diagrams for the individual hubs or for all the hubs together. The Pure CO2 emission and Pure Life Cycle Costs files are the Sankey diagrams for the optimization of only one of the objectives without doing a trade-off between both.
3. Folder "Results Tables"
It contains the resulting Excel tables of each optimal solution with all the details of performance, design and operation.
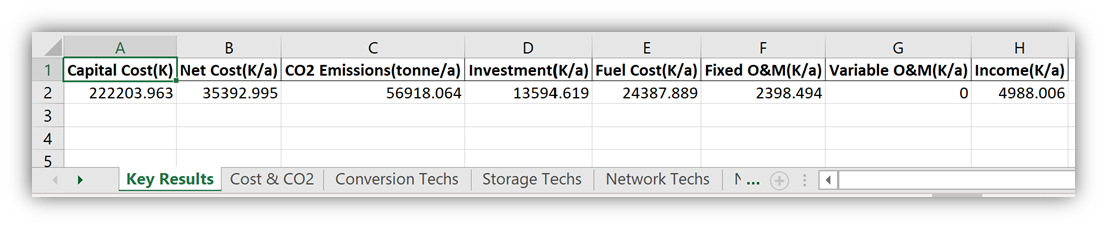
3.1. “Key results“ sheet
– Costs and CO2 emissions
– Investment costs [k]: Initial one-time cost for the installation of the proposed energy system
– Net cost [k/a]: Yearly total costs including installation, fuel and operating and maintenance cost
– CO2 Emissions [tonne/a]: Yearly CO2 emissions
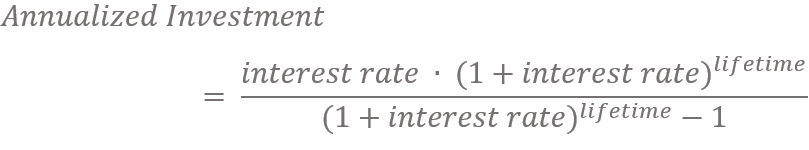
– Annualized Investment [k/a]: annualized investments costs based on interest rate and lifetime of the technologies installed.
– Fuel costs [k/a]: Yearly costs for fuel imports such as electricity, gas, etc.
– Fixed O&M [k/a]: Yearly fixed operation and maintenance costs independent of the output produced
– Variable O&M [k/a]: Yearly variable operation and maintenance costs depending on the output produced
– Income [k/a]: Income from exports, e.g. renewable electricity fed into the grid
3.2. “Cost & CO2“ sheet
– Information about individual Costs and CO2 emissions of every technology, import & export and network
3.3. “Conversion Techs“ sheet
Information about each conversion technology and their use:
– Hub: Hub in which the chosen technology is recommended to be installed
– Technology: Name of the chosen technology
– Capacity [kW]: Optimal installation capacity of the chosen technology
– ECs In: Input energy carriers used by the technology
– ECs Out: Output energy carriers of the technology
– Total Energy In [kWh]: Total energy input in kWh of the given “ECs In” over a year
– Total Energy Out [kWh]: Total energy output in kWh of the given “ECs Out” over a year
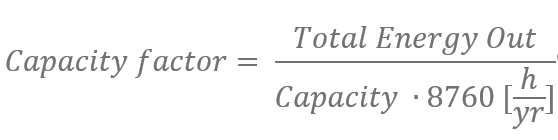
– Capacity Factor: Ratio of the total energy output to the maximum energy output
3.4. “Storage Techs“ sheet
Information about each Storage Technology and their use
– Hub: Hub in which the chosen technology is recommended to be installed
– Technology: Name of the chosen technology
– Capacity [kWh]: Optimal installation capacity in kWh of the chosen technology
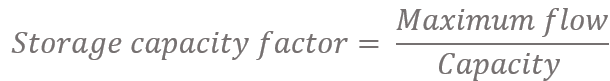
– Storage Capacity Factor: Ratio of the maximum flow (in- or output) to the maximum energy output– Charge Cycles: Number of full charge and discharge cycles
3.5. “Network Techs“ sheet
Information about each Network Technology
– Hub-Out: Hub the network link comes out of
– Hub-In: Hub the network link goes into
– LinkID: ID of the network link
– Network Technology: Name of the chosen network technology
– Capacity [kWh]: Optimal installation capacity in kWh of the chosen Network Technology
– Flow +ve [kWh]: Network flow in kWh over a year flowing from Hub-Out to Hub-In
– Flow -ve [kWh]: Negative network flow in kWh over a year from Hub-In to Hub-Out
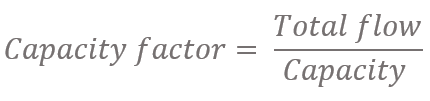
– Capacity Factor: Ratio of the total energy output to the maximum energy output
3.6. “Network Flows“ sheet
Information about the hourly use of each network link for a year.
3.7. “Imports“ sheet
Information about the hourly imports of energy carriers in kW for each hub for a year.