
Dealing with price linearization
To define prices of technologies in a more detailed way than one single linearization curve, different segments can be defined. On the table below, instead of a single-curve linearization represented in blue, there curves are created for the following segments: < 100 kW, 100 to 500 kW and > 500 kW.
For a reminder on how to create a price curve based on costs for different dimensions, please refer to this video (in German).
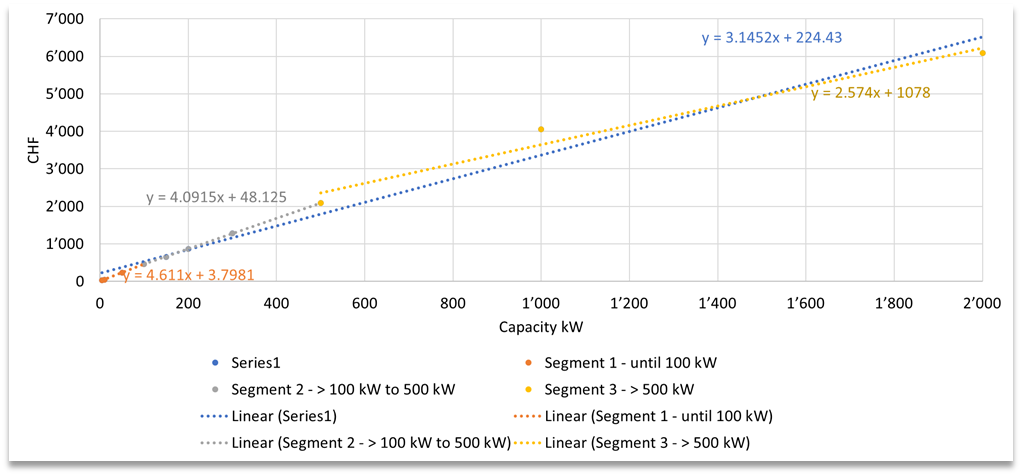
Figure 69 Linearization of technology costs example for more accurate cost mapping
The same technology can then be replicated three times: each time, with the costs mapping one of these segment curves. Through specifying maximum and minimum capacity constraints, the correct technology will be chosen, depending on the necessary capacity. Please note that adding many technologies with specified minimum capacities (> 0 kW) may result in longer solving times, due to the nature of Sympheny's algorithms.
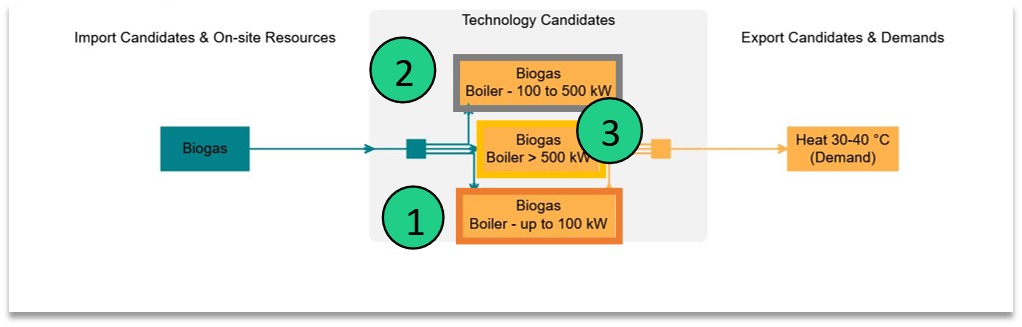
Figure 70 System diagram containing three technologies with different cost curves
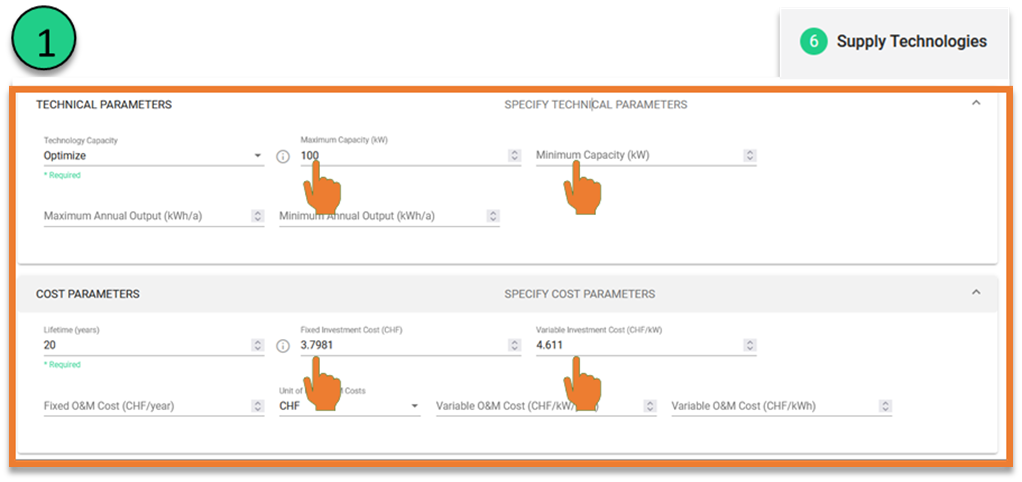
Figure 71 Set-up parameters for the first technology to use the linearized cost parameters and capacity limit
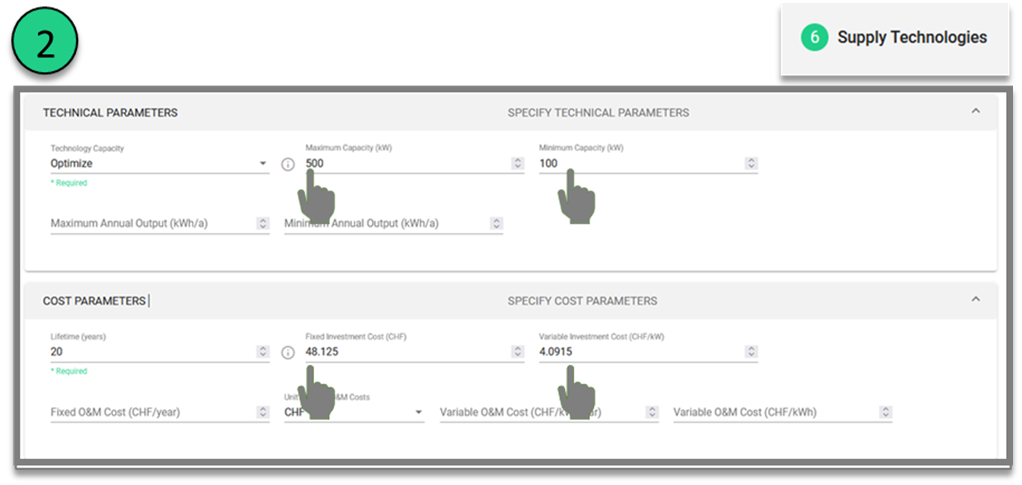
Figure 72 Set-up parameters for the second technology to use the linearized cost parameters and capacity limit
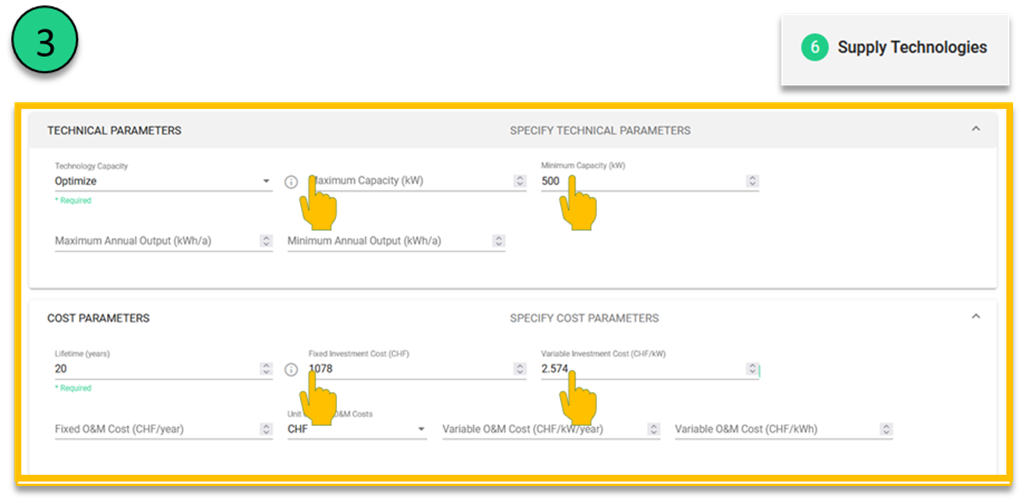
Figure 73 Set-up parameters for the third technology to use the linearized cost parameters and capacity limit