
Sympheny: Energy Model faster. See more. Share better.
Sympheny deployed a set of upgrades that make it easier to prepare data, run focused optimizations, and communicate results—at building, site, and district scales.
What’s new at a glance
-
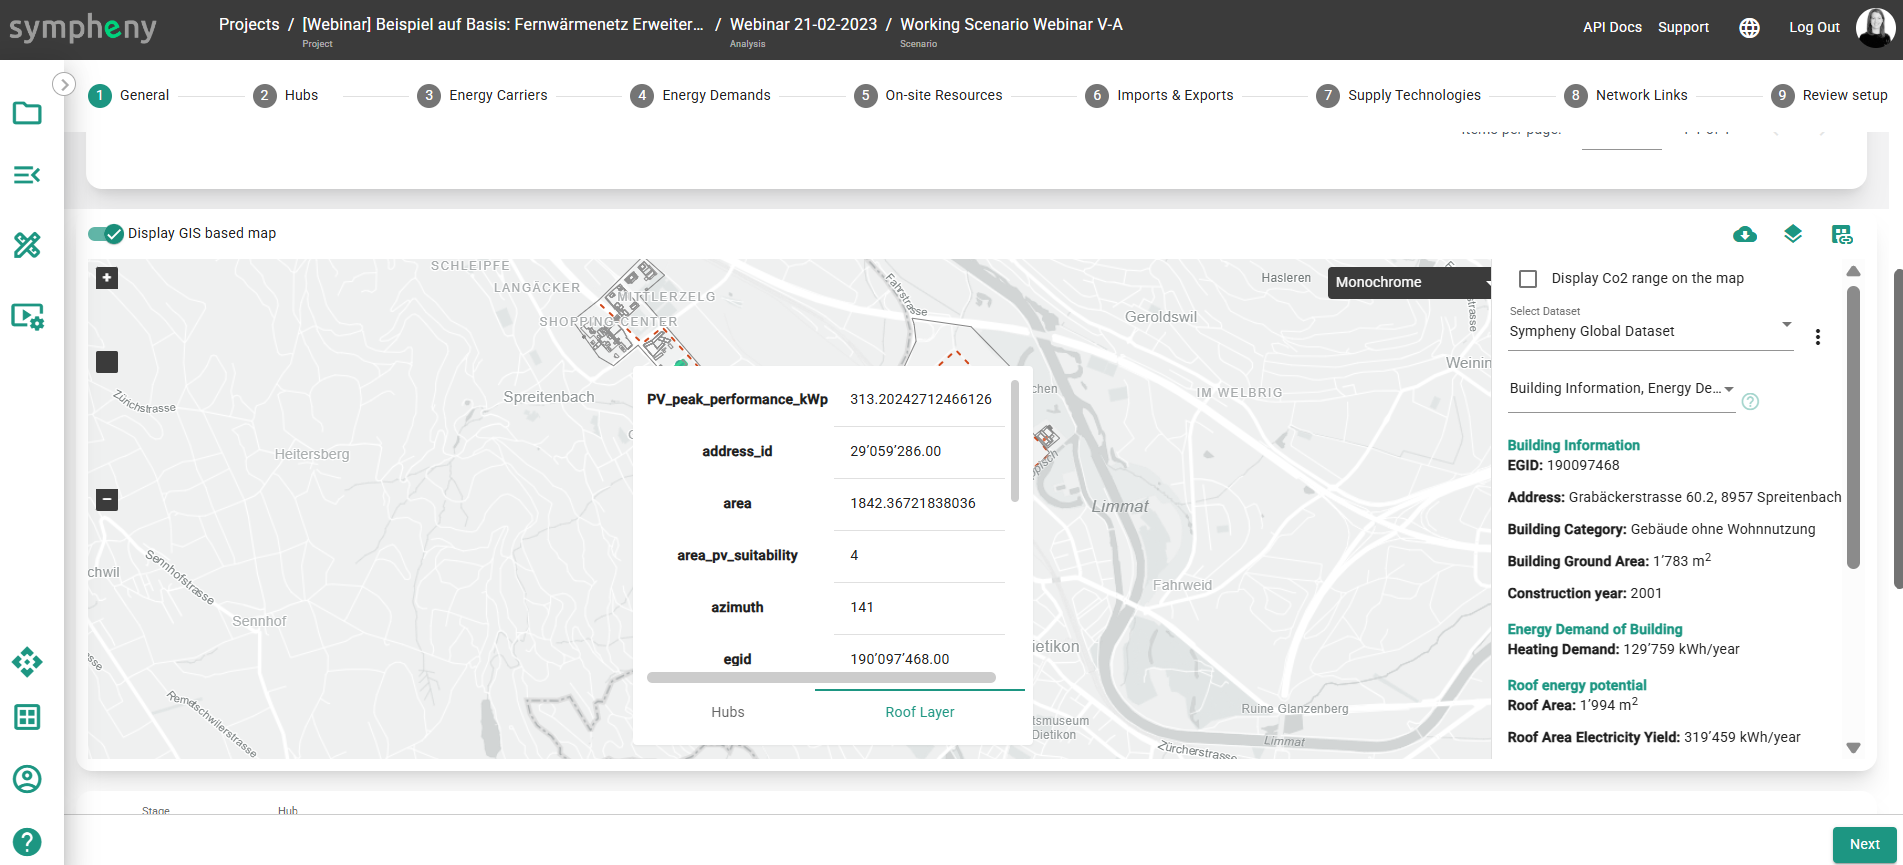
Download GIS data (now with building-level detail).
Export the spatial layers you create in Sympheny—complete with per-building attributes—for downstream GIS, CAD, or reporting workflows.-
Create energy hub with geoadmin, OSM or geoimpact building level dataset 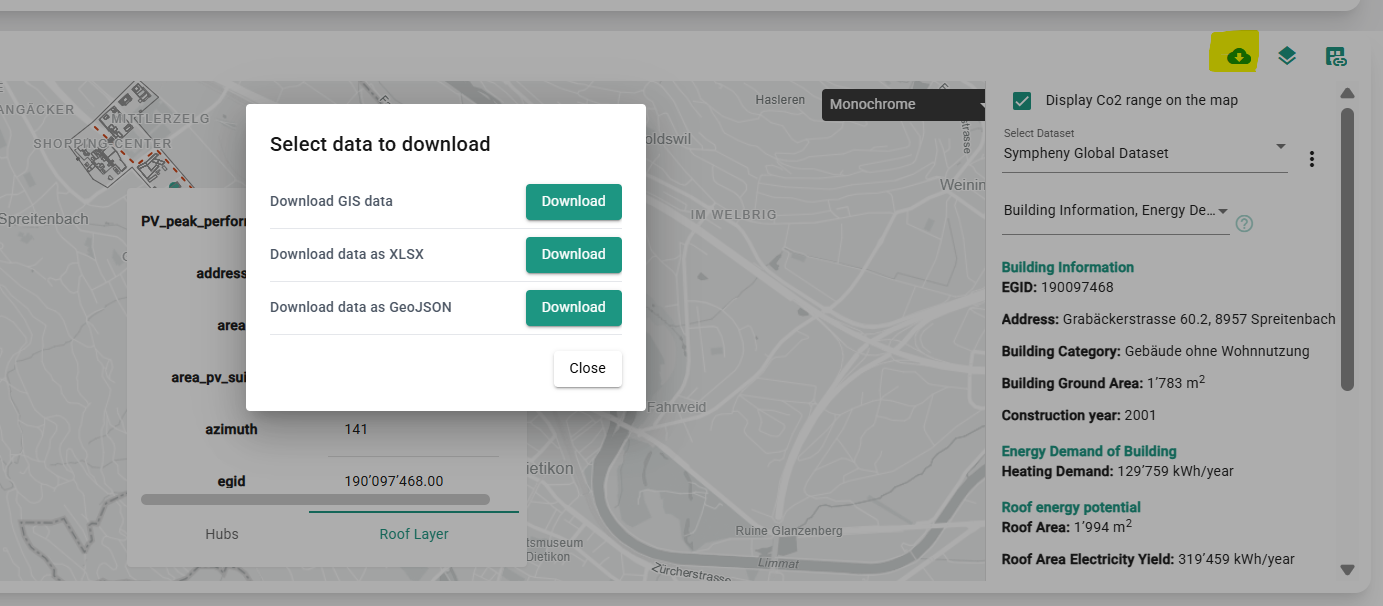
Download the full dataset
-
-
Single-objective runs.
Run scenarios against one chosen objective (e.g., cost or CO₂) when you want a fast, focused answer. -
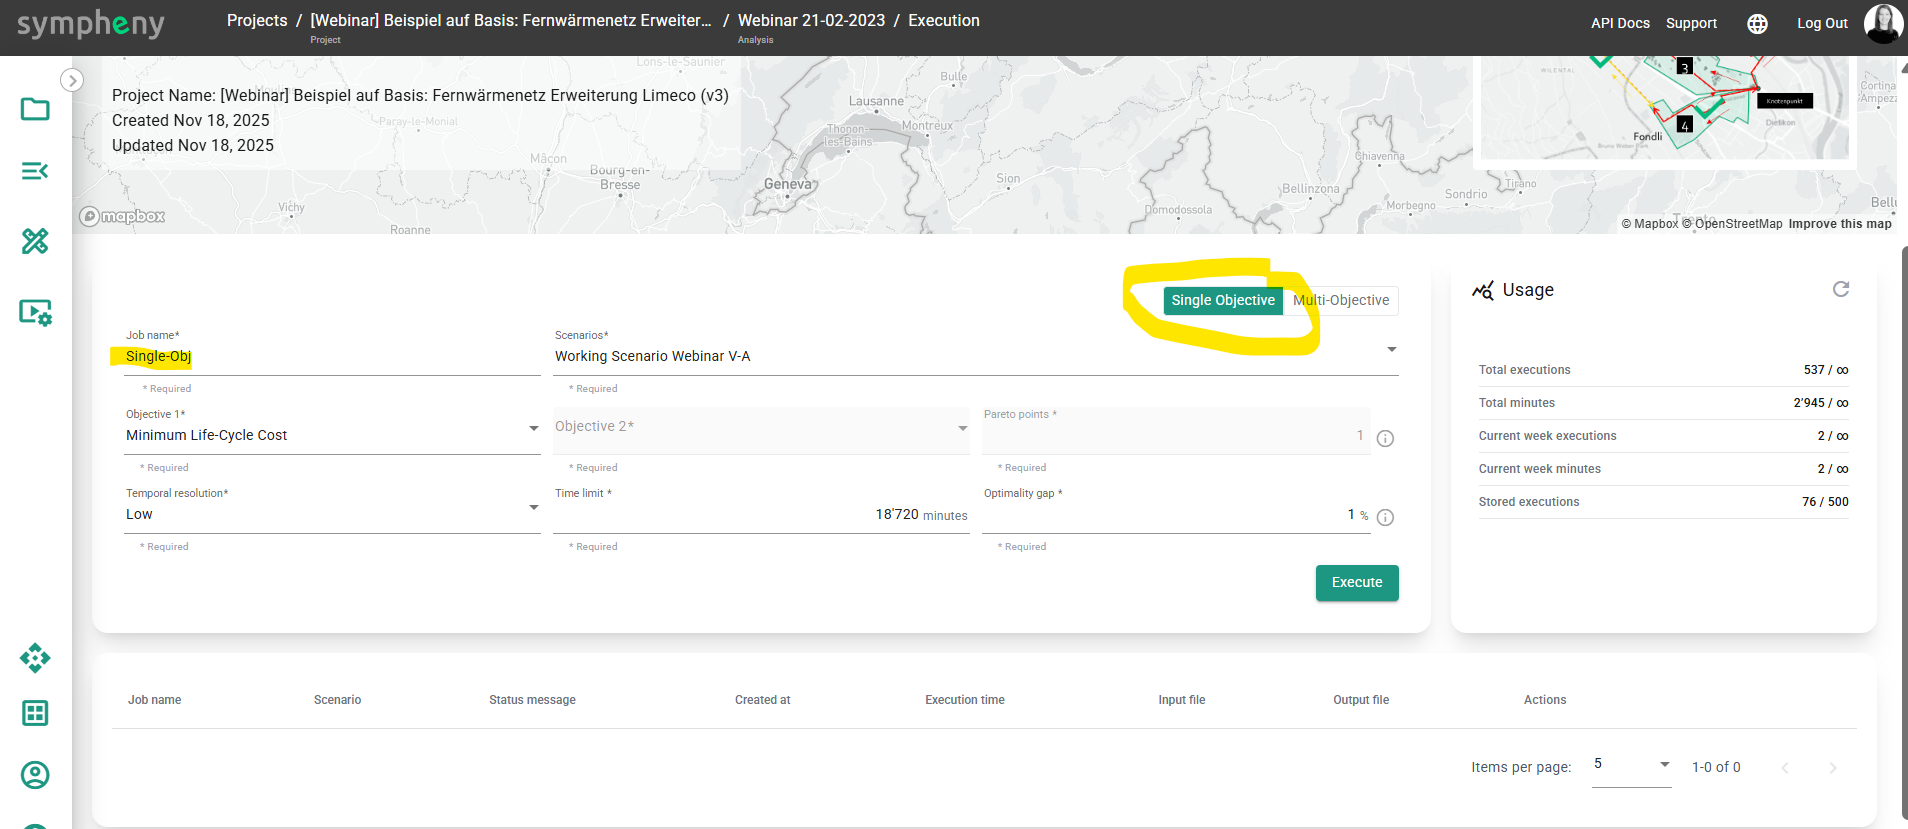
Run single objective function - e.g. minimize electricity import from grid by minimizing import
-
Global OpenStreetMap queries.
Pull international OSM layers directly in Sympheny to accelerate site setup anywhere in the world. -
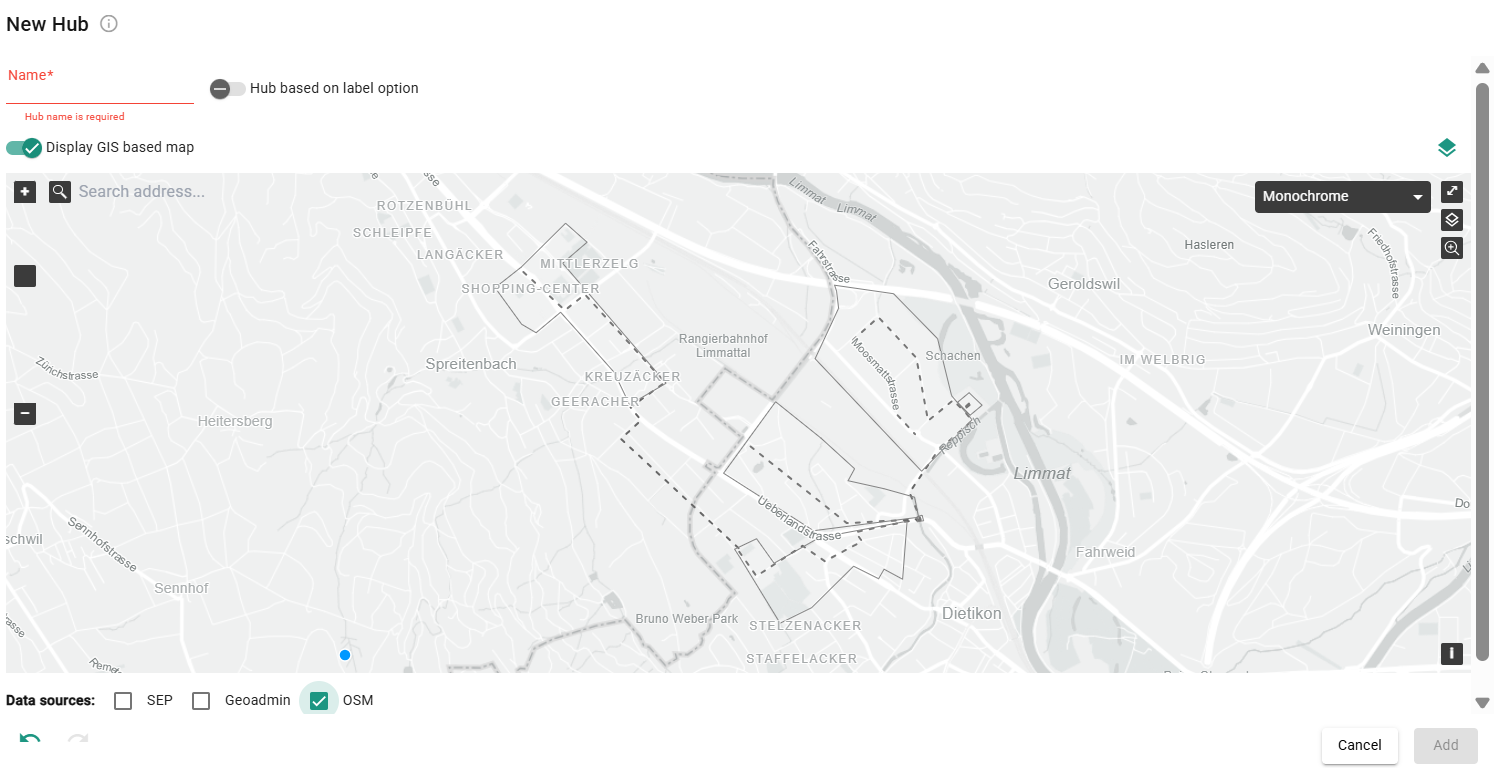
Select OSM data to create an energy hub with building level information worldwide
-
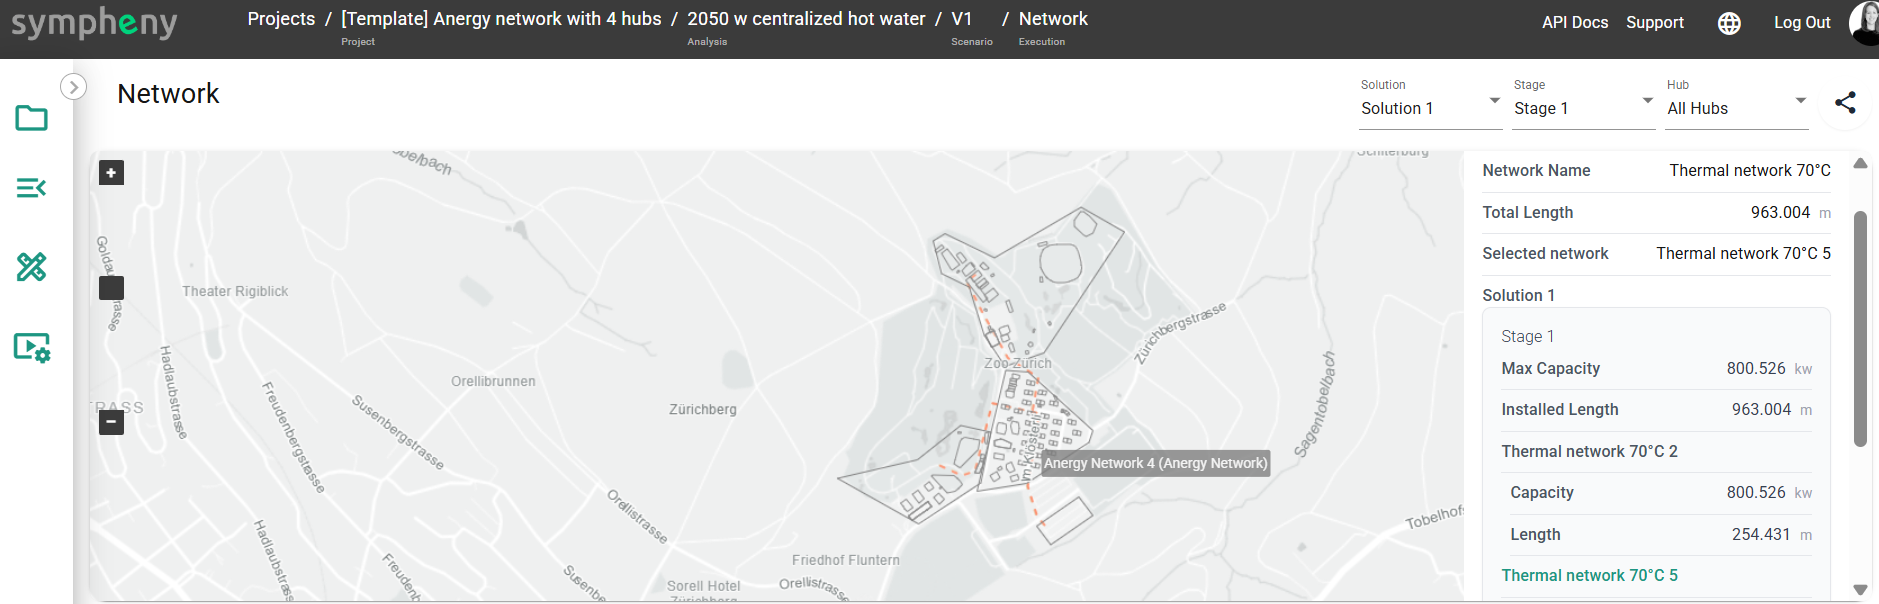
Network visualization + KPIs (Dashboard v3).
See optimized networks on the map and track headline KPIs (e.g., cost, CO₂, capacities) at a glance.
-
EnyMap (light mode).
Create scenarios from a simple Excel input file—perfect for rapid “what-if” variants without full model authoring.
-
EnyTool.
A companion toolkit for power users to automate data prep and batch scenario runs > https://support.app.sympheny.com/user-guide/latest/enytool -
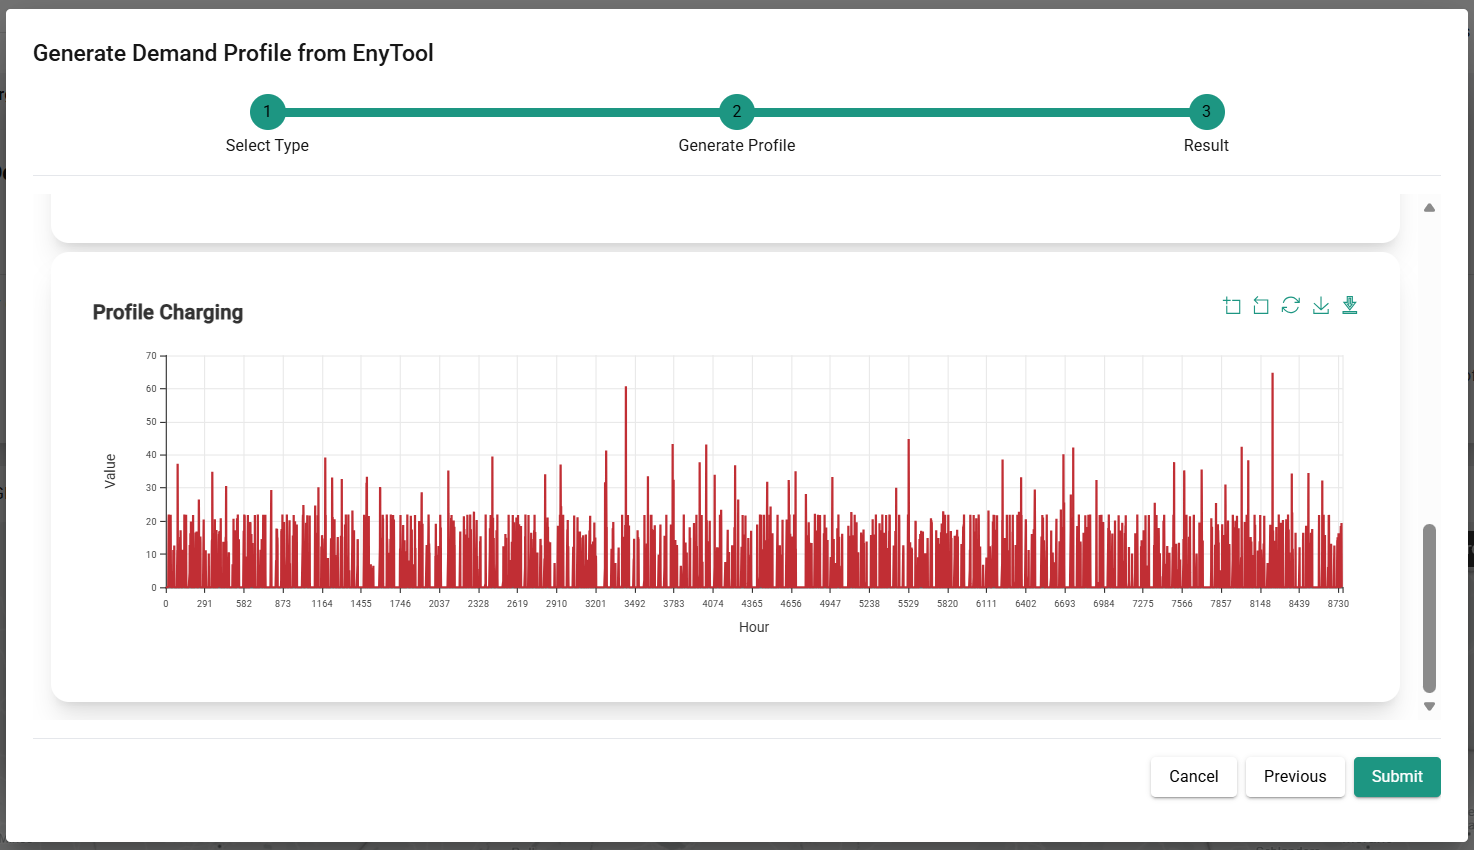
Ramp mobility demand generator > https://support.app.sympheny.com/user-guide/latest/enytool-ramp-tool-suite-synthetic-demand-modelling
-
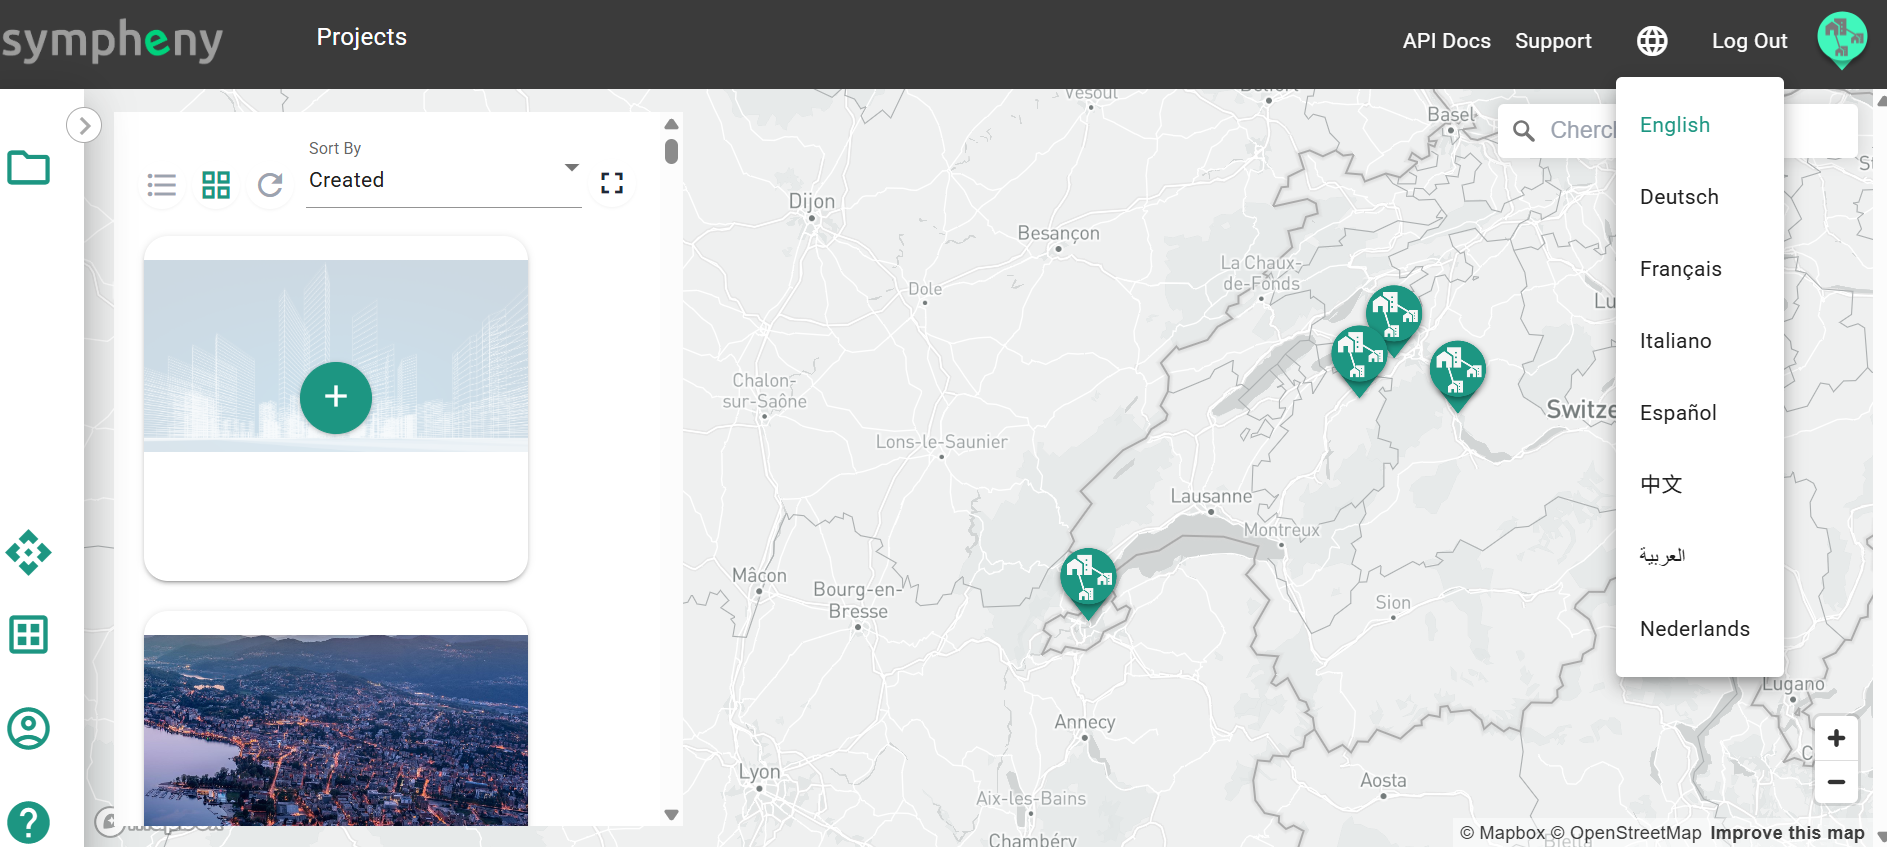
Multi-language UI.
Use Sympheny in multiple languages (initially including English, German, French, and Italian), with easy switching per user. -
Benefits
-
Less prep time: bring in global context fast and export clean GIS for stakeholders.
-
Faster answers: single-objective runs speed iteration.
-
Clear storytelling: network views and KPIs turn results into decisions.
-
Scale your workflow: EnyMap + EnyTool enable variant generation and automation.
-
Work your way: collaborate across teams and regions with a multi-language interface.